
Insect Monitoring Data
Why collect insects?Aquatic macroinvertibrates give us a window into the health of the Rogue River. At each site, all the different habitats are sampled where key species can be found and collected, then tallied up to help us come up with a water quality score.
The different orders of insects can be grouped into three categories, based on how much they tolerate pollution: TOLERANT These orders of insects easily tolerate things like higher levels of nutrients, such as nitrates and phosphates, as well as higher levels of turbidity and sedimentation. These insects are not as picky about what kind of substrate is found on the river bed, and are often scavenger type feeders. Finding more of these insects than any other category gives way to a poor water quality score. SOMEWHAT TOLERANT These insects are slightly pickier than the tolerant orders, meaning, they are somewhat tolerant of pollutants and sedimentation. SENSITIVE these orders of insects can only be found in waters of high or good quality. They need certain temperatures, stream flow velocity and food. The more species of this category that are found, the higher the likelihood of the water quality score being higher. What do insects tell us about water quality?After insects are collected from the field, they're brought to an area where you can pick them out and sort them out by insect order. They're then sorted into the three categories listed above, and the numbers are recorded on the data sheet shown below. The numbers of organisms then fall into the categories of Rare (1-10) or Common (11 or more). The number of rares and the number of commons are then multiplied by a factor that has been determined by a water quality model developed by experts. Once these numbers added together, a water quality SCORE is determined to be Excellent, Good, Fair or Poor.
Check out the data sheet below! 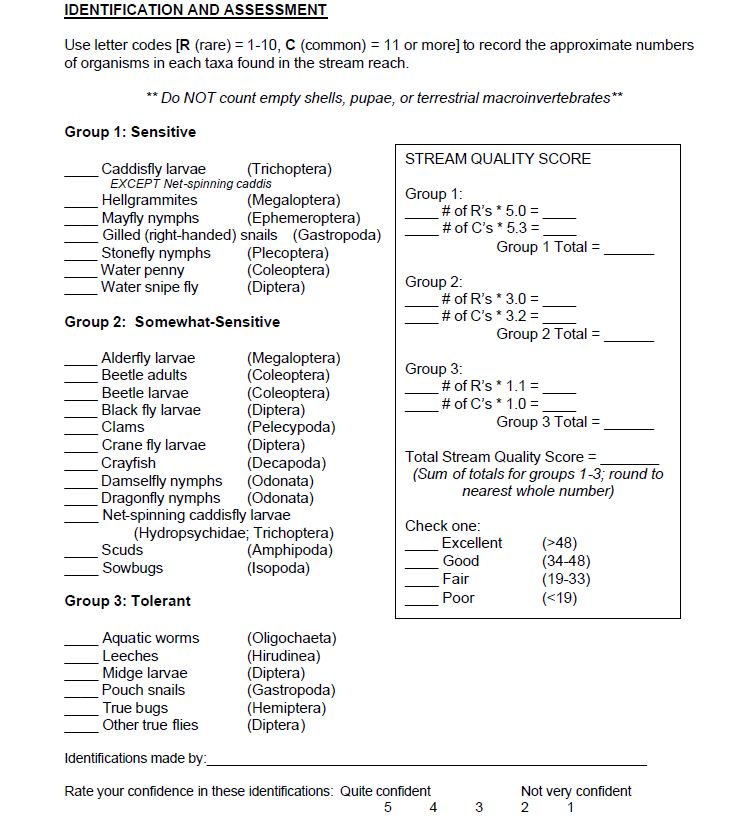
|
Can I look at the past data?
OF COURSE YOU CAN!
Click on the files below to download an excel spreadsheet that provides collection data, as well as water quality scores from years past, at five different sites within the Rogue River Watershed. This data has been collected since 2010 by the Trout Unlimited Home Rivers Initiative.
| ||||||||||